The Netflix Engagement Panic Is Wrong: Q2-26 Earnings Review
What the NFLX engagement doomers, the FCF headlines, and the price-target cuts all get wrong.

Accrued Interest TLDR: Netflix’s Q2 was fine... the tape just refuses to believe it. Revenue grew 13.4% to $12.56B and EPS grew 11% to $0.80, both in line, and the full-year guide held: $51.0-$51.4B of revenue, a 31.5% operating margin, ~$12.5B of free cash flow, and ads doubling to ~$3B. The sell-off is a multiple problem, not an estimates problem... the target cuts kept their Buy ratings and cited valuation, not earnings. The engagement panic ignores that 2% hours growth matches the entire three-year trend, churn (~2% per Antenna) is the industry’s lowest, and revenue per hour is compounding. Underneath: record 0.87x asset turnover, ~43% normalized ROE with falling leverage, and a record $4.7B buyback with $27.1B authorized. This is a company quietly graduating into blue-chip cash-compounder status while the market prices it for decay. At ~$67 pre-market, that is 18.7x 2026 earnings... below the S&P 500. Penalty box now, weighing machine later.
One quick reminder: Accrued Interest goes paid next Wednesday, July 22. Pledge your subscription now, the first 100 pledges lock in $199/year ($16.58/month), forever, before the price goes up on July 23rd.
0. INTRODUCTION
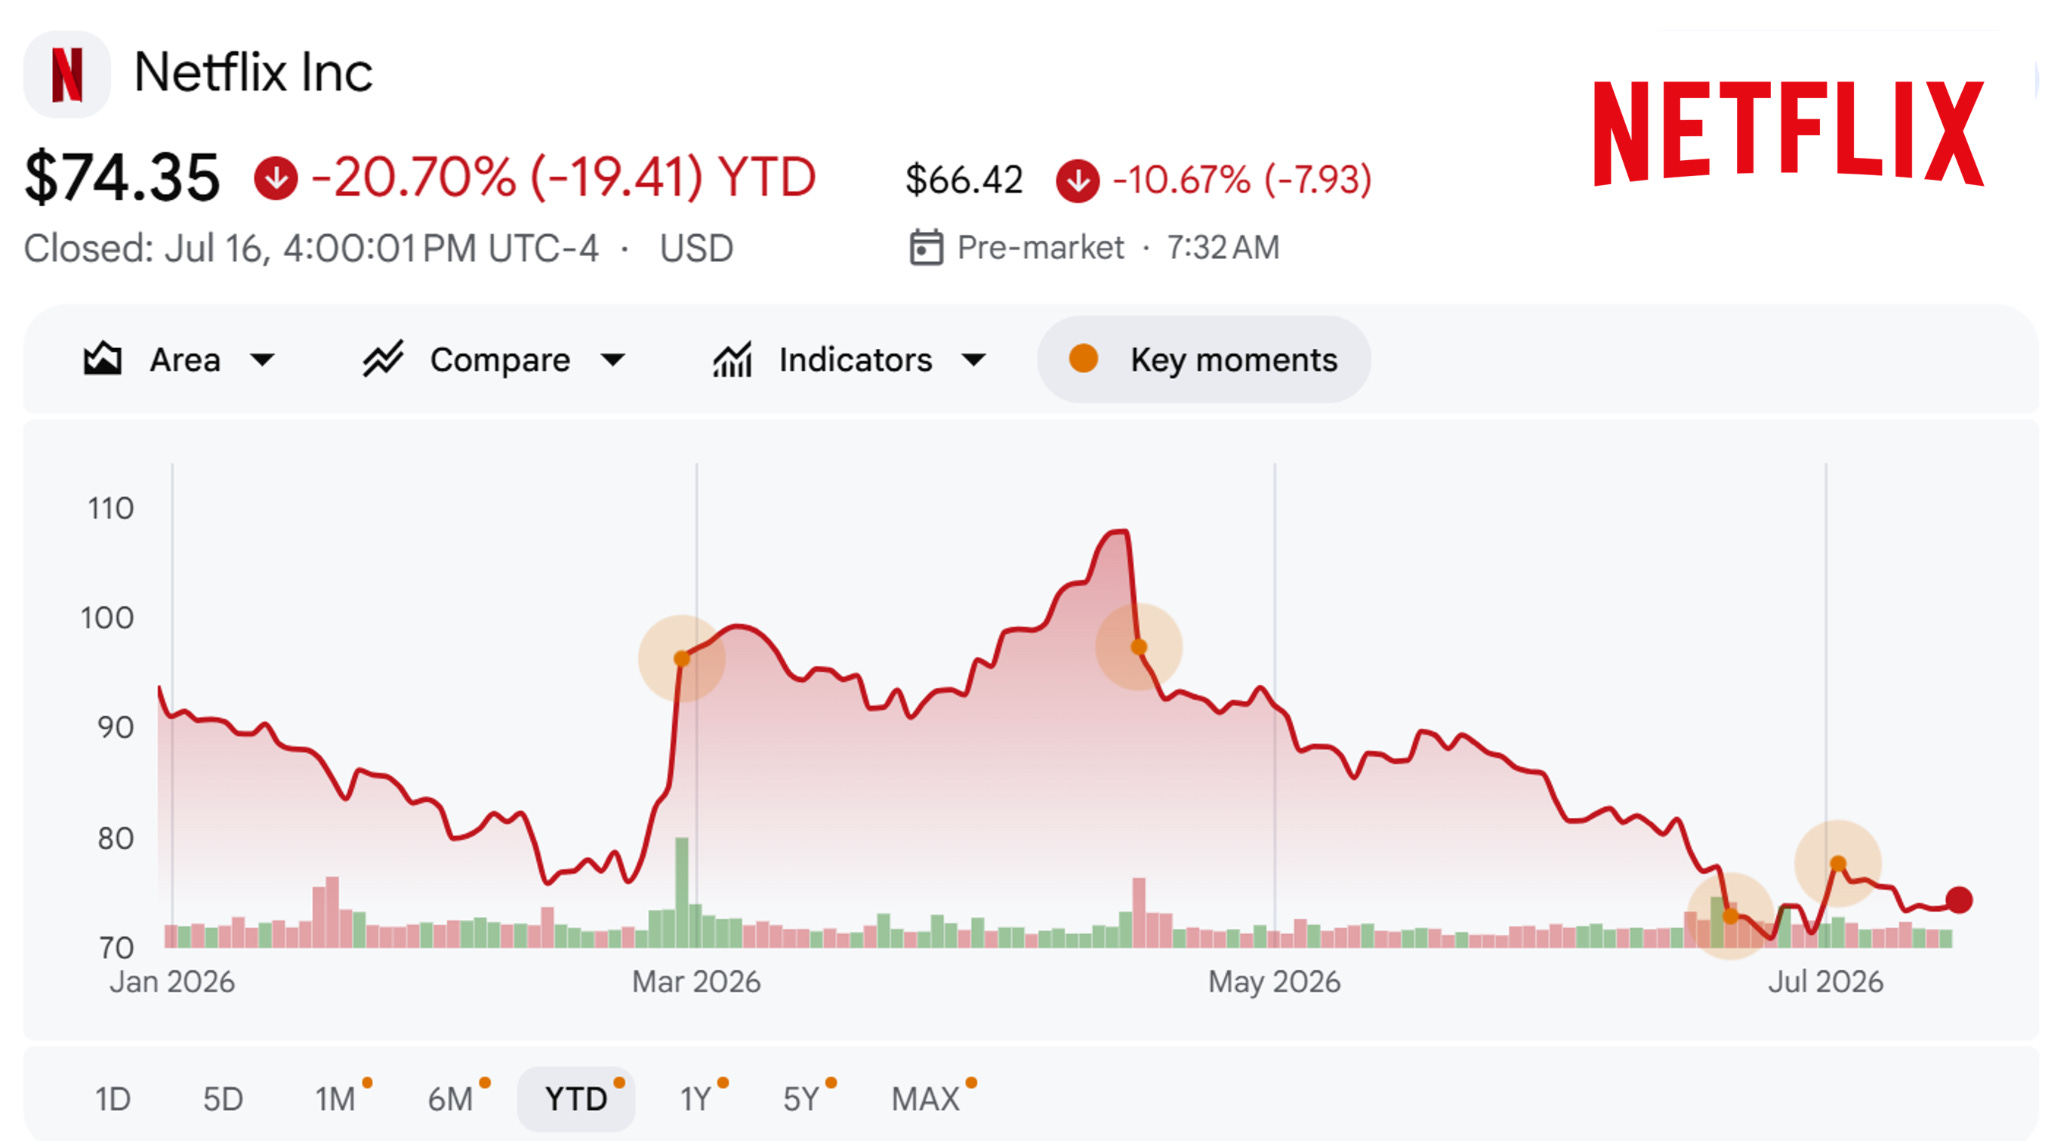
Netflix stock is selling off hard right now, and I want to start by telling you exactly why, with no sugarcoating. The perception forming in the market is that Netflix has become the very thing it spent two decades destroying: a slow-growth legacy media company. The narrative says engagement on the platform is falling, and that management, by cutting one of their engagement reports from twice a year to once, is hiding numbers because the truth is worse than it seems. As someone who is very online, I have read all of it. I would not recommend it.
The narrative gets more hyperbolic from there. They say the only reason Netflix bid on Warner Bros. Discovery was because the core business was failing. They say the news that Netflix kicked the tires on Roku is another sign of desperation. And now there is a rumor, which Netflix has denied, that they are looking at Lionsgate... supposedly yet another tell that the builders have run out of things to build.
Here is how I can tell this is a perception problem and not a fundamentals problem: look at what the analysts actually did. The price-target cuts came in a wave... Citi to $100, Oppenheimer to $100, KeyBanc to $92, Bernstein to $100... but every single one kept a Buy-equivalent rating, and by their own words the cuts reflect “valuation concerns rather than a weakening long-term outlook.” They are lowering the multiple, not the business. The handful who nudged 2026 EPS down (Bernstein, Wolfe) pinned it entirely on the World Cup pulling viewing for a couple of quarters... and those same analysts raised their 2027 numbers on the ad-tier expansion. When the bears’ own models show a dip caused by a soccer tournament followed by reacceleration, that is not a broken business. That is a multiple getting re-rated on sentiment while the earnings power stays right where it was.
And what I hate most about the engagement debate is that it ignores the one engagement metric that actually settles the argument: churn. How many customers actually cancel your service? Third-party subscription trackers like Antenna consistently peg Netflix’s churn at around 2% monthly... the lowest in the entire streaming industry, and it is not close. People can complain online that they do not like what is on the home screen. If they do not cancel, the complaint means nothing.
I want to be honest with all of you, because that is the deal here. The only thing that fixes a perception problem is time and execution. Ben Graham said it best: in the short run, the market is a voting machine, tallying up popularity and mood... in the long run, it is a weighing machine, and what it weighs is profits. Peter Lynch made the same point with numbers. He wrote that over a few months or even a few years there is often no correlation between a company’s results and its stock, but over the long term, the correlation between what a company earns and what its stock does is 100 percent.
So I will state it up front: I think Netflix is going to be in the penalty box for the rest of the year. They are going to need several quarters of consistent execution to prove the doubters wrong, and no blog post, including this one, will speed that up. What I can do is what Accrued Interest does: focus on the numbers and cut through the noise. This post is going to be more accounting-heavy than most of the Q2 coverage you will read today. That is the point.
1. The Quarter by the Numbers
Here is the message of the financials once you tune out the noise: the quarter was fine. Better than fine.
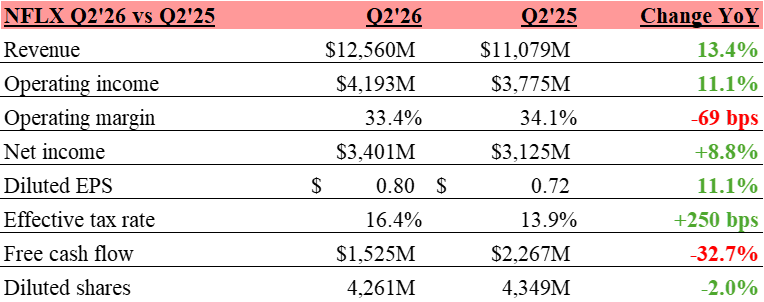
Both revenue and margin came in right in line with guidance, and management held the full-year outlook: revenue narrowed to $51.0-$51.4B (13-14% growth) and the operating margin guide stayed at 31.5%. Now the highlights, one at a time.
Revenue growth was a healthy 13%. If this is what a dying business looks like, then Paramount, Disney, and the rest of legacy media should file for bankruptcy protection immediately, because 13% growth at a $51 billion revenue run-rate is very good. Full-year revenue guidance did not budge. Dying businesses cut guidance. This one narrowed it to the same midpoint.
Netflix has arguably the highest operating margins in global streaming entertainment, north of 33% this quarter. Yes, the margin contracted 69 basis points from last year, and as someone who actually read the financials, I can tell you why: timing. The letter states it plainly... content amortization growth is front-loaded in the first half of the year, and they continue to expect amortization to grow slower in the second half, up roughly 10% for the full year against 13-14% revenue growth. The margin story is a second-half story, by design of the amortization schedule, and it is guided, not hoped: Q3 margin is projected at 33.2% versus 28.2% a year ago.
Net income grew almost 9%. Again, not dying. The only reason the bottom line grew slower than operating income (+11.1%) is tax: the effective rate rose from an unusually low 13.9% to a more normal 16.4%. That is not a business problem, it is arithmetic. Buybacks shrank the share count 2%, which is why EPS still grew 11%.
Netflix is a free cash flow monster, and the “FCF miss” headlines are optics. Yes, quarterly FCF of $1.5B was down 32% from $2.3B. But if you read the letter instead of the headline, they tell you why: cash tax payments were higher due in part to the Warner Bros. termination fee... the breakup payment Netflix received when the WBD deal died, which hit Q1 as income and had to be taxed in Q2. First-half FCF was actually $6.6B versus $4.9B last year, and they reiterated roughly $12.5B of free cash flow for the full year. For perspective: Disney’s entire company, theme parks and cruise ships included, generated about $10.1B of free cash flow in fiscal 2025. Netflix is guiding to more than that from streaming alone. Strip out the parks and it is not even a conversation... in pure entertainment, Netflix is the biggest cash machine in media.
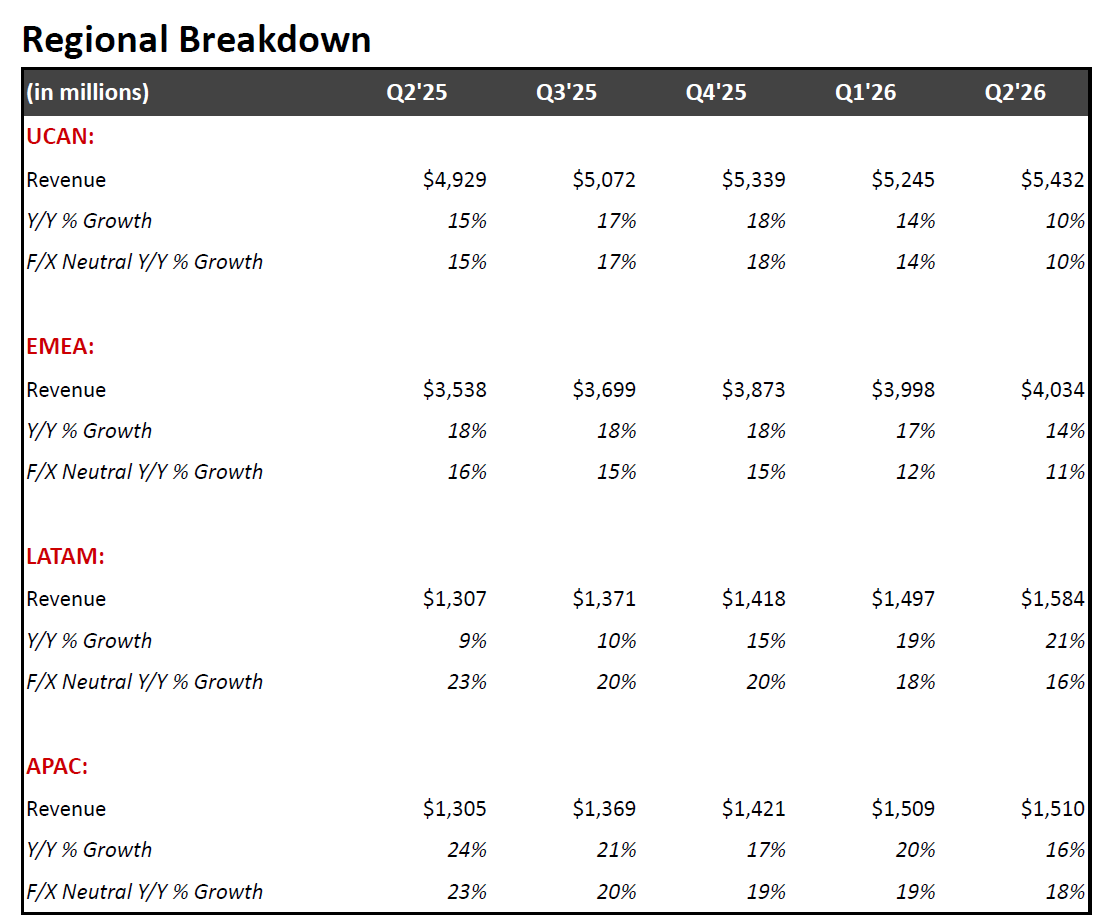
Regional growth was strong and underappreciated. Netflix posted double-digit revenue growth in every single reporting region: UCAN +10%, EMEA +14%, LATAM +21%, APAC +16%. EMEA crossed $4.0B in quarterly revenue for the first time, and LATAM and APAC each crossed $1.5B. And the first-half price increases in the US, Mexico, and Spain are performing consistent with prior changes and with expectations. Translation: they raised prices and kept the subscribers. That is pricing power, observed in the wild.
Engagement was a quiet win, whatever Twitter tells you. There is a lot of debate about what it means that total viewing hours grew 2% in the first half of 2026. I would point out that hours growth for all of 2025 was 1.5%. I see no evidence of cratering engagement... I see engagement growth completely consistent with the last few years, achieved in a half that contained both the Winter Olympics and the World Cup, two of the biggest eyeball-vacuums on the planet. Meanwhile the slate delivered: Harlan Coben’s I Will Find You (87M views) is the most-viewed new original series debut of 2026, Swapped (137M views) is tracking to become their #2 original animated film ever behind KPop Demon Hunters (which just notched 52 consecutive weeks in the Global Top 10), and non-English content was more than a third of all viewing this half. I think the freak-out over the engagement report cut is badly overstated, because Netflix already publishes more viewing data than any competitor... but I will get to that in a bit.
2. The Negatives First
I am not hiding from the truth here, so let’s do the bad news before the good news.
Revenue growth is decelerating and they know it. The sequence is 16.2% in Q1, 13.4% in Q2, and 12% guided for Q3. UCAN, the most mature and highest-margin region, slowed to +10%, and that is with a partial-quarter benefit from the recent price increase. When your price lever is already firing and growth still steps down, the deceleration is structural, not just optics. Management offered a partial defense on the call... last year’s growth was more back-half weighted, so the comparisons get tougher... which is fair, but does not change the direction of travel.
Free cash flow fell by a third year over year. The termination-fee tax explanation is legitimate, but the second half now has to do real work to hit the ~$12.5B full-year guide, and content additions grew 28.5% in the quarter. I will be watching the cash content spend closely. If the spend-to-amortization ratio drifts above the guided ~1.1x, I will tell you.
3. Now the Positives
Engagement held up against a brutal comp, and nobody is grading it on a curve. What irks me about the engagement commentary is that people analyze Netflix in a complete vacuum, which is not how we evaluate any other entertainment company. View hours grew ~2% in H1’26 versus 1.5% for all of 2025, and they did it while the Winter Olympics and the World Cup were pulling viewing toward live sports and broadcast. Growing engagement at all in an Olympics-plus-World-Cup year is a real signal, not a soft one.
Nobody seems to care that Netflix is growing an advertising business at a rapid clip. Ads were reiterated at roughly $3 billion for 2026, a rough doubling year over year. Programmatic access was just opened to Pause Ads and live inventory, US upfront commitments are expected to close within weeks, and AI-powered tools now run across the full advertising lifecycle. Greg Peters said on the call that the gap between ad-tier revenue per member and the ad-free tier “is narrowing,” and described that gap as, in his words, “essentially near-term underrealized revenue growth.” This is the monetization step-change the whole bull case rests on, and they did not walk back a dollar of it.
The content slate delivered. I Will Find You was the biggest series launch of the year. Swapped is chasing KPop Demon Hunters for the all-time animated crown. The K-drama Teach You a Lesson is on track to become the second most watched Korean show in Netflix history. This is the “quality, variety, quantity” flywheel actually working, not merely being asserted. And this week’s Emmy nominations, where Netflix landed a nomination in nearly every category, are not the résumé of a platform with nothing to watch.
Capital return stepped up hard. Netflix bought back $4.7 billion of stock in Q2, the largest repurchase quarter in company history, after the board authorized an additional $25 billion in April. There is $27.1 billion of capacity remaining. Management buying back their own stock at this scale tells you where their conviction sits. They are voting with the balance sheet while the market votes with its feelings.
4. The Engagement Report: A History Lesson Everyone Memory-Holed
Now let me deal directly with the controversy of the quarter, because I think the hoopla is overblown, and the history matters.
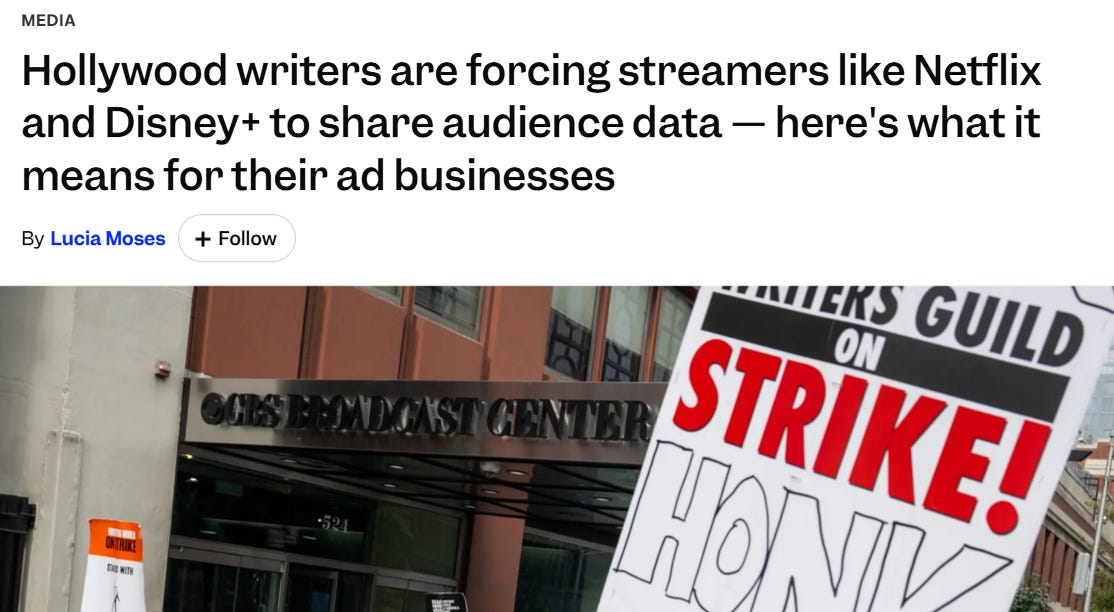
First, some context that has been conveniently forgotten. Netflix only began publishing the comprehensive What We Watched report in late 2023, with the first edition covering the first half of 2023. And it was not created for investors. It was created in the middle of the writers’ and actors’ strikes, when Hollywood was in a fierce fight over streaming royalties and there were open accusations that Netflix was hiding viewership so it could underpay talent. The report was Netflix’s transparency olive branch to writers, actors, agents, and guilds... a way for the supply side of the business to see how shows actually performed so the residuals debate could happen with real numbers. It became a semiannual investor fixture almost by accident. So we have roughly three years of aggregate hours data. That is the entire history everyone is panicking about.
Here is that history:
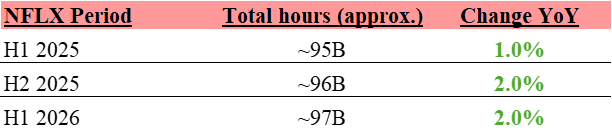
Engagement growth has sat in a 1-2% band for the entire time it has been trackable. This year’s ~2% is not a deceleration, and it is not much of an acceleration either. It is the same low-single-digit plateau it has always been, which is exactly why the metric became a lightning rod: it moves so little that everyone projects their priors onto it.
And at Accrued Interest we focus on math, so let me show you the denominator problem everyone is ignoring. Total hours grew 1-2% while the member base grew much faster... Netflix now serves roughly 330 million paying households and an audience management says is approaching one billion people. Do the division: if the numerator grows 2% and the denominator grows high single digits, hours per member is falling. Management does not hide this. They have said it plainly on recent calls: view hours per member household is coming down, and they attribute it to mix... new members are increasingly in lower-viewing-intensity geographies (they repeatedly cite Japan, where households watch half to two-thirds as much as US households) and on lower-priced plans. Under that reading, existing members are not watching less. The average falls because the newest cohort is structurally lighter-viewing. That is a genuinely different story from “people are losing interest,” and to be fair to the bears, you cannot fully distinguish the two from the disclosed data. But the churn number can: if people were disengaging, they would cancel, and they are not canceling.
And there are only 24 hours in a day. You cannot compound share of everyone’s waking attention forever. The point is not to grow hours to infinity. The point is what you earn per hour. Which brings me to the number that should end this debate: revenue grew 13% while hours grew 2%. That spread is Netflix getting dramatically better at monetizing every hour on the platform... through pricing, through plan mix, through a doubling ads business. Greg Peters put it perfectly on the call: “there is not a linear relationship between view hours and revenue and profit,” because all hours are not created equal. Live programming will be about 5% of this year’s content budget and only ~1% of view hours... yet live events have driven six of the top ten new-member sign-up days of the past five years. Kids animation is the mirror image: the same 5% of spend driving roughly 8% of hours. Same investment, wildly different hour-counts, similar business value. Judging Netflix by raw hours is like judging a bank by the number of transactions instead of the profit per transaction.
The market is myopically focused on top-line revenue growth and raw engagement. Revenue growth is key, but it is not the only metric, and Netflix was not wrong when they said they want the conversation centered on revenue and operating profit. People did not like hearing it. It is still the truth.
One more structural point. The majority of Netflix’s revenue... about 57%... comes from outside North America. UCAN was 43% of Q2 revenue; EMEA was 32%, LATAM 13%, APAC 12%. Which brings me to the most common fallacy in all of media investing: people evaluate the company through their personal taste. Every take you read today will implicitly be someone judging Netflix by the last show they or their brother-in-law watched. I want to state this outright: it is flatly impossible for you to judge Netflix’s content slate from your couch, because you have no idea how the slate is performing outside your home country, and most of the money is outside your home country. The Polygamist, adapted from a Zimbabwean novel, is a smash out of South Africa. Rosario Tijeras is in its sixth season in Mexico. Teach You a Lesson is rewriting the Korean record books. I blame part of this on the American conviction that we are the center of the universe. This is your periodic reminder that we are not.
And a related fallacy: a huge share of top engagement comes from kids and family content, which the very-online commentariat does not watch and therefore does not count. I find it genuinely funny that the narrative is “there’s nothing good on Netflix” barely a year after KPop Demon Hunters became a global cultural phenomenon that is still charting after 52 straight weeks.
Now, the report change itself. Everyone complaining about the cadence going from two to one is telling on themselves: they do not read the other reports Netflix puts out. Here is what Netflix publishes, every single week, and will continue to publish. Every Tuesday, four global Top 10 lists: Film (English), TV (English), Film (Non-English), TV (Non-English), each with weekly hours viewed, views, runtime, and cumulative weeks on the chart. Alongside those, country-level Top 10 lists for nearly 100 countries and territories. Plus running all-time “Most Popular” lists based on each title’s first 91 days. The underlying data is downloadable as raw files with history back to 2021. No other streamer publishes anything close to this.
What Netflix actually cut was the cadence of the single most data-intensive report... the semiannual file covering ~99% of all viewing including the long tail... from twice a year to annually, starting 2027. The letter’s own words: the goal is “to keep the focus on our primary financial metrics,” revenue and operating profit, and the letter explicitly commits to continuing title-by-title and total view hours data. This is a cadence cut on one report, not an information cut. The comprehensive dataset still gets published; it just arrives annually.
And think about it like an auditor for a second. If management were concealing deterioration, the tell would be cutting the high-frequency data... the weekly country-level lists and quarterly title figures that would expose a downturn fastest. They are doing the opposite: keeping all of that and trimming the slow-moving semiannual dump. People who actually read Netflix’s disclosures know they are the most transparent company in streaming about what gets watched. But today, people want to be mad.
I will concede one thing to the critics, because fair is fair: the timing looks defensive. Reducing any disclosure while the metric plateaus invites exactly this reaction, and Netflix’s IR team should have seen the optics coming. The optics are bad. The substance is not.
Oh, and for those worried about second-season drop-off as the hidden engagement rot: Ted Sarandos addressed it directly on the call. In aggregate, “season 2 falloff is actually slightly improved this year,” across regions and categories. Netflix shows fall off from season one because Netflix launches are enormous... most competitors’ shows start small and have nowhere to fall from.
5. Now For Some Accounting, So I Can Earn Your Subscription
This is the analysis the talking heads never bother to do, but at Accrued Interest I stayed up all night and did the work. What the noise is obscuring is that Netflix’s business model is the healthiest it has ever been, and it is improving on precisely the metrics value investors are taught to watch.
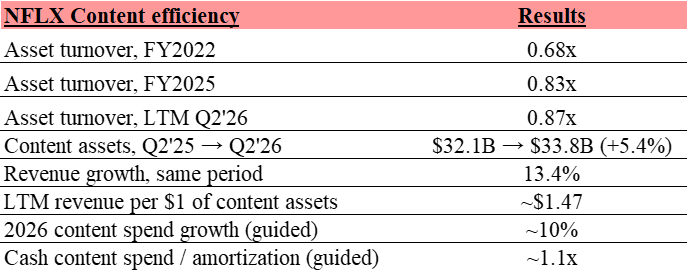
They are sweating the content library harder every year: asset turnover keeps climbing. Asset turnover (revenue divided by average total assets) has gone from 0.68x in 2022 to 0.83x in 2025 to roughly 0.87x on a trailing basis through Q2. The mechanics this quarter were textbook: revenue grew 13.4% year over year while total assets grew only 10%, and content assets... the biggest item on the balance sheet... grew just 5.4%, to $33.8B. Trailing revenue per dollar of content assets is now about $1.47. Sarandos said it in one sentence on the call: “We grow the content spend slower than revenue.” Content expense is guided up ~10% this year, versus an 8% average over the past five years and 14% over the past decade, and the cash-spend-to-amortization ratio is guided to ~1.1x. Every dollar of library is producing more revenue than it did the year before. That is what monetizing your portfolio better looks like in the actual financial statements.
Return on equity is enormous, still rising, and rising the healthy way. Netflix’s ROE has climbed from a trough of about 24.5% in 2022 to 42.8% in 2025. The trailing figure through Q2 prints near 49%, but I will be honest with you where the headline flatters: that includes the one-time WBD termination fee that landed in Q1. Strip it out and normalized ROE is roughly 43%... still grinding higher, still among the best of any large-cap on the board. And here is the part that matters for quality: it is rising without leverage. Gross debt sits at $14.3B against $9.1B of cash... call it $5B of net debt against $12.5B of expected annual free cash flow, which is to say, nothing. The equity multiplier has actually fallen from ~2.5x in 2022 to ~2.0x today. Instead, the equity base is being disciplined by buybacks: shareholders’ equity declined this quarter, from $31.1B to $30.2B, even while the company retained $3.4B of earnings, because $4.7B walked out the door to repurchase shares. Rising returns on a shrinking equity base with falling leverage. Nobody can wave this away as balance-sheet engineering, because the balance sheet is de-levering while it happens.
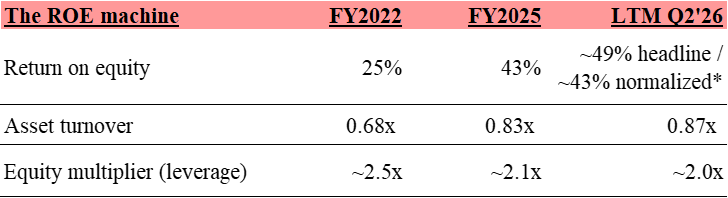
*Normalized excludes the one-time Warner Bros. termination fee that landed in Q1’26. The headline trailing figure flatters; the ~43% is the number I trust.
And margin, the biggest lever of the past four years, is loaded for the second half. Trailing operating margin is 29.7% today. The full-year guide of 31.5%, against 29.5% in 2025, implies operating income growth north of 20% this year. First-half margins were flat year over year (32.9% both years) by design of the amortization schedule... and the expansion becomes visible again in Q3, guided to 33.2% versus 28.2% a year ago. A five-hundred-basis-point year-over-year margin swing, in guidance, from the management team whose guidance philosophy is literally “our actual internal forecast.”

Look at that bottom row and the margin story tells itself: the first half of each year is amortization-heavy by design, the back half is where the leverage shows up, and the Q3’26 guide against the 28.2% comp is the biggest year-over-year expansion on the board.
Put it together and Q2 was the quarter where all three legs of the ROE machine were visible at once: turnover made a new high on a slow-growing asset base, the margin lever is cocked for the back half, and the capital-return program stepped up to record size while leverage kept falling. The revenue deceleration everyone will quote today... 16.2%, 13.4%, 12% guided... is real, but it is the least informative number on the page relative to what is happening underneath it.
6. Valuation: The Penalty Box Discount
Netflix closed yesterday at $74.35, fell more than 9% after hours, and is indicated around $67 in the early pre-market. So let’s value it at $67.
Per consensus estimates from TIKR, analyst GAAP EPS estimates for Netflix are $3.59 for 2026, $3.84 for 2027, and $4.57 for 2028. One caveat: analysts are refreshing their models overnight as I write this, so consensus is still a moving target and these figures may shift slightly by the time you read this. At $67, that prices Netflix at:
18.7x 2026 earnings
17.4x 2027 earnings
14.7x 2028 earnings
By my count, Netflix is now trading at about 18.7 times this year’s earnings... below the S&P 500 multiple, which sits in the low 20s. Netflix is by no means a below-average company. As long as it keeps performing as it is, the stock is very cheap at roughly 17 times 2027 and less than 15 times 2028.
The difference between a value buy and a value trap is that a multiple is only cheap so long as earnings keep growing. By slashing the multiple while barely touching the out-year estimates, investors are implicitly saying they expect the earnings to slow later. I totally disagree, and here is why I do not think the estimates get cut: the advertising tailwind is only beginning. Netflix revenue this year is about $51 billion, of which roughly $3 billion is advertising. There is room for that ad number to grow to multiples of itself as a share of the pie, and ad revenue arrives at dramatically higher incremental margin... the content is already paid for, the fixed costs are already sunk. Advertising lets Netflix extract more revenue per subscriber without raising anyone’s monthly bill. And behind that sits the runway Spence Neumann laid out on the call: an audience approaching one billion people, under 45% penetration of roughly 800 million addressable households, about 7% of a $670 billion addressable revenue pool, and only ~5% of global TV view time. His words: “in many ways, we’re still just getting started as a company.”
As for the M&A rumors feeding the desperation narrative, Sarandos answered it in five words on the call: “we are primarily builders, not buyers.” They denied the Lionsgate reports, they declined to chase speculation, and the capital allocation actions... a record buyback, no big acquisition... match the words.
I want to be honest with you: I think it will probably take a year of execution for this narrative to die. Sometimes the only thing a company can do is ignore the haters and keep posting the earnings. And if they hit these targets, the buyback does a lot of the compounding work by itself... every quarter of pessimism is a quarter of cheaper retirement for the share count.
In many ways, Netflix is the victim of its own success. I have followed this company for over 20 years. For more than a decade, the narrative was that Netflix was a cash-burning machine, buying unprofitable content, never to earn a real profit. Over the past several years, Netflix quietly became the biggest cash-flow-generating machine in all of publicly traded media. The margins are the highest in the industry. The ROE is the highest. Asset turnover keeps improving. The machine gets better in every measurable way, and the measurable ways are the ones I trust.
For now, Netflix bulls like me just need to be patient. I am going to keep reporting the numbers. If they decline or the targets get missed, I will happily be the first to point it out. But right now I see a company morphing into a blue-chip cash-generating powerhouse while being priced like a melting ice cube. And that $25 billion buyback, the largest in company history, is standing by to take shares off the hands of the impatient who do not care to wait.
Let me know your thoughts on the quarter in the comments! And join my chat, where I’ll be following up on reader questions throughout the day.

Relevant tickers: NFLX 0.00%↑, DIS 0.00%↑, CMCSA 0.00%↑, PSKY 0.00%↑, WBD 0.00%↑, ROKU 0.00%↑, FOXA 0.00%↑
— Accrued Interest
Disclaimer: The information presented in this Substack is for educational purposes and should not be construed as investment advice. Investors should make their own decisions regarding the prospects of any company discussed here, as I am not a registered investment advisor.
You can always reach me at simeon@accruedint.com.