Nintendo Is Not the Apple of Video Games
Attach rates, the installed base ceiling, and the PC gaming migration all say what the stock price doesn't: this hardware company does not deserve a software multiple.
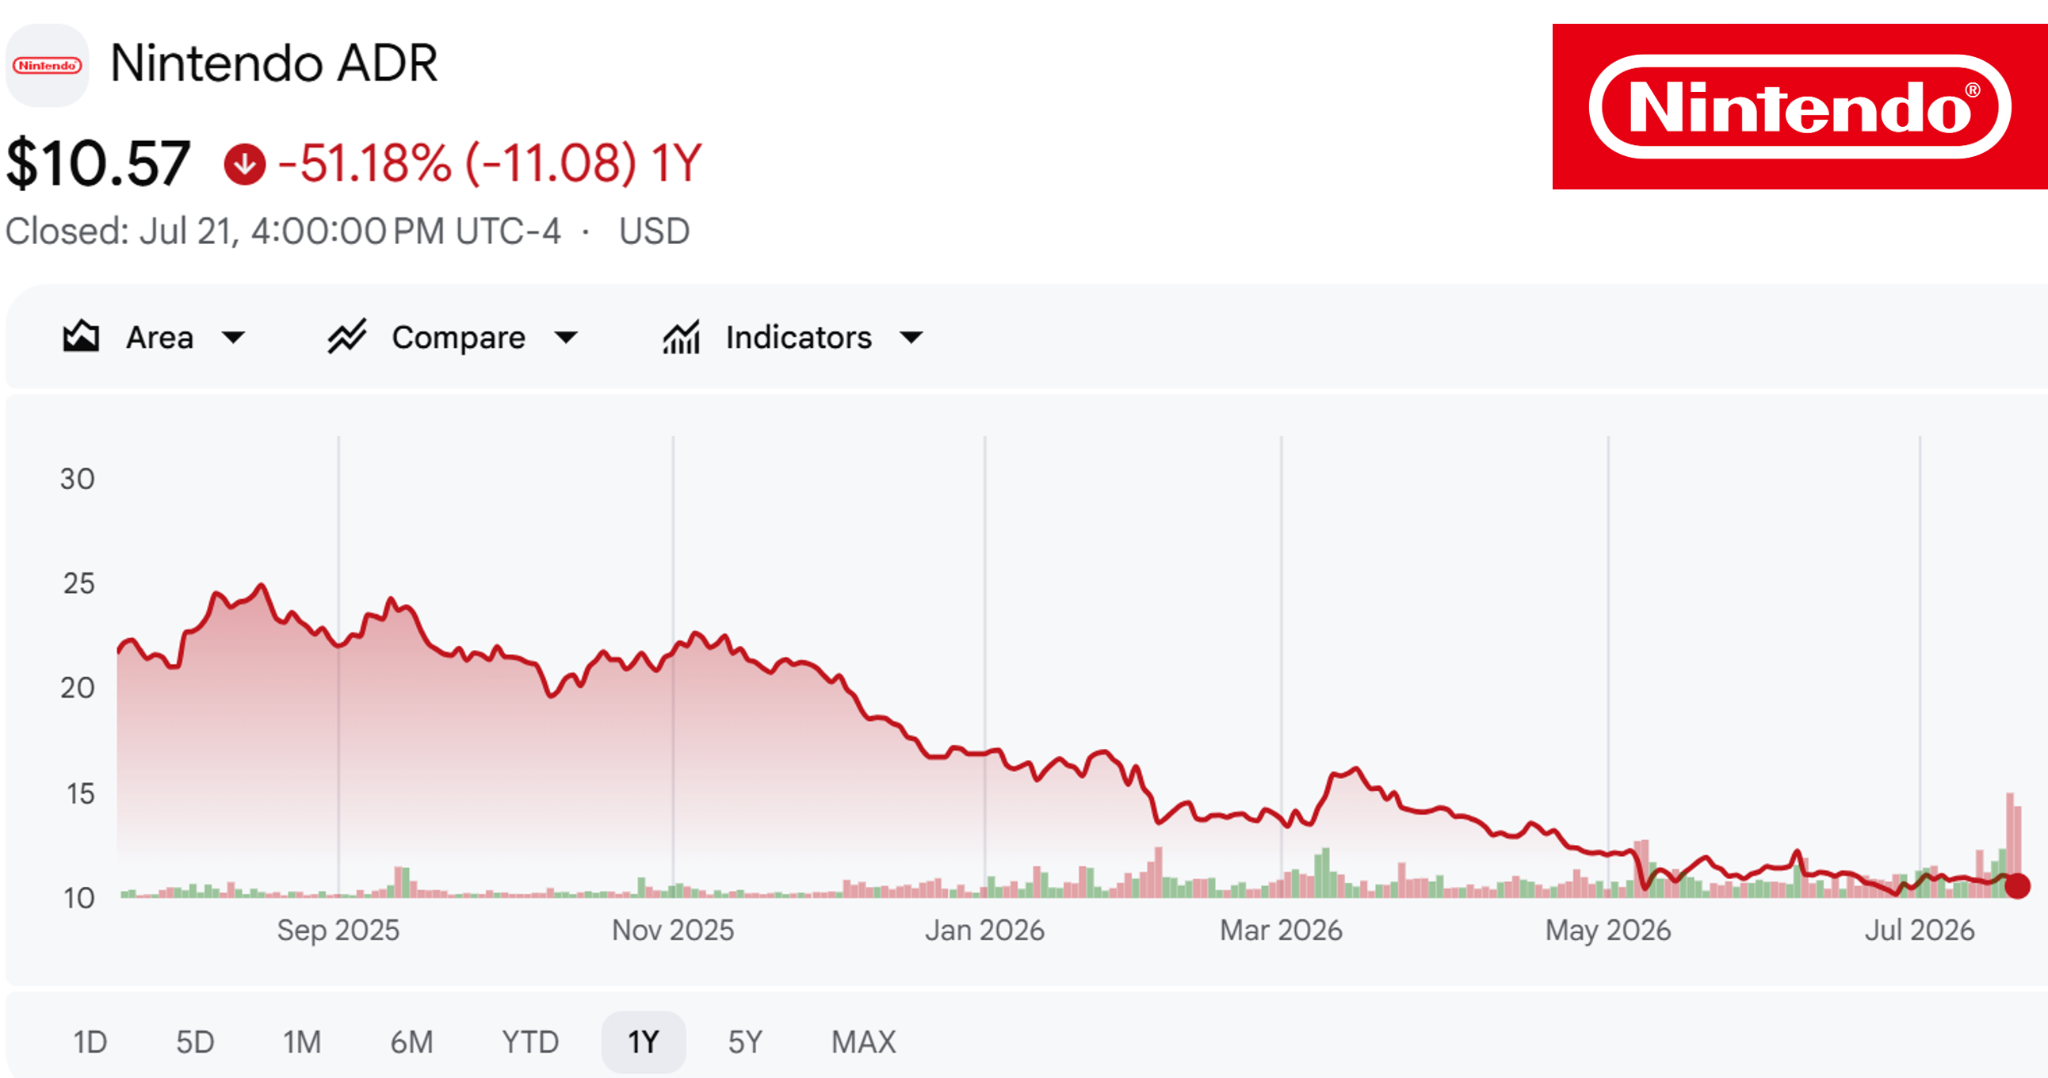
Accrued Interest TLDR: Nintendo’s ADR (Ticker: NTDOY) sits at $11, down roughly 56% from its 52-week high of $24.92, yet Wall Street still rates it with 17 Buys, 7 Holds and only 2 Sells. I think consensus is getting Nintendo very wrong. The new Switch 2 console is simply not selling enough games to keep the ecosystem healthy. Its organic software attach rate, once you adjust for the Mario Kart World bundles that Nintendo books as hardware sales, is 1.82, roughly half the original Switch’s 3.57. The gaming industry is migrating to PC and $30-$50 games, while Nintendo pushes game prices to $80 and raised the Switch to $500 before its 1 year anniversary. Switch 2’s lifetime ceiling is trending far below the 155 million Switch 1 installed base. Trading at roughly 21x forward earnings, Nintendo’s valuation is on par with Microsoft and higher than Sony, which makes no sense. If you own Nintendo and have been tempted to buy the dip, I am here to tell you the difficult truths the sell-side won’t. Let me explain why I expect Nintendo stock to Underperform the S&P 500 over the next 12 to 18 months.
0. Introduction
This article is for everyone out there who has been wondering how Nintendo’s beloved brand is arguably bigger than ever before, but its stock has been a dud, massively trailing the S&P 500 for years at a time.
Here’s the setup. Twenty-six analysts cover Nintendo and the average price target clusters around ¥10,200-10,800 vs. the current Tokyo price near ¥7,000, implying Wall St. analysts think the stock is 45% to 55% undervalued. The bulls’ argument is essentially that this time is different for Nintendo. They claim that the Switch 2’s backward compatibility will help grow its installed user base. Bulls say the NSO (Nintendo Switch Online) system makes customers sticky, and the digital mix makes revenue recurring. Some substack writers claim Nintendo has built a walled garden that works like Apple’s: proprietary hardware, tightly integrated software, and fierce brand loyalty that locks users in. If true, then Nintendo has finally graduated from a cyclical hardware company into a platform that deserves a software multiple.
Let me be clear: no, this time is not different. Any time someone compares a company to Apple, one of the most dominant businesses in human history, my first instinct is to be skeptical. The company’s fiscal 2026 results, released this May, reveal the structural reality: Nintendo is a cyclical hardware company whose software economics are weaker than launch headlines imply. The erosion of the organic attach rate, management’s down-year guidance, and the broader industry shift toward a platform and price tier where Nintendo does not compete are all documented facts.
I am not calling for the stock to crash. Nintendo stock already fell more than 50% from its August 2025 high of $24.92, and the multiple has compressed from an absurd ~42x trailing at the peak of the hype to roughly 21x forward today (20.6x precisely; I’ll round to 21x).
But Nintendo’s current P/E multiple remains at a premium relative to its historical average and its closest industry peer, yet there is no apparent catalyst to trigger an upward re-rating. This deep dive will explain why the stock is unlikely to return to its recent high-water marks in the near future. The real issue is that the core bull narrative has structural cracks that overly optimistic investors are choosing to overlook, with their attention buried deep in their Super Mario Galaxy popcorn buckets.
1. Giving the bulls their due
Before I take the bull case apart, some intellectual honesty. Here’s what has gone right:
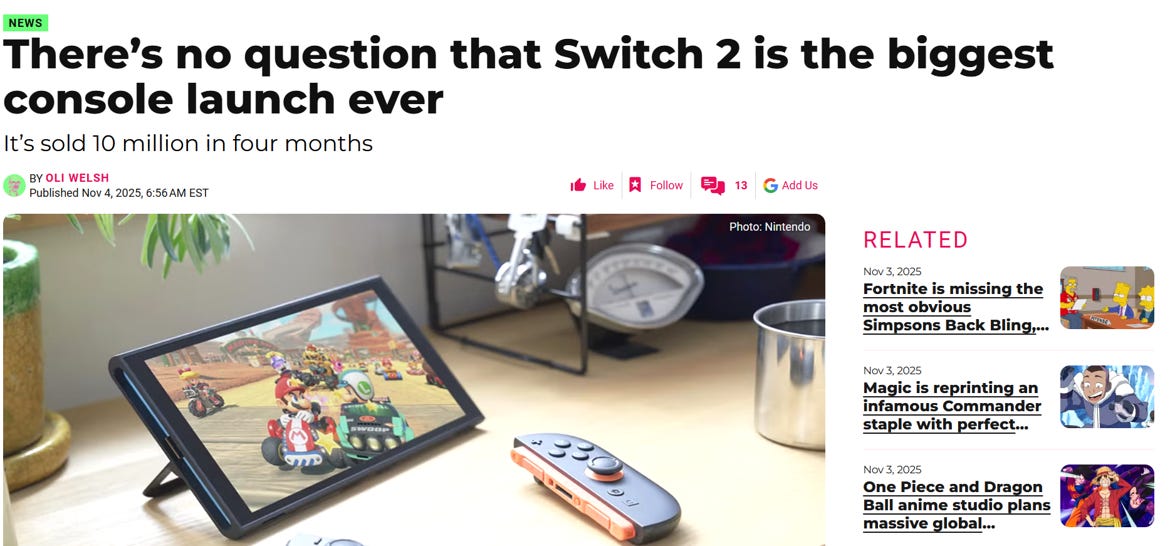
By unit volume, the Switch 2 achieved the most successful console launch in history, proving that Nintendo can still generate massive global demand. Moving 19.86 million consoles in just ten months, the system eclipsed the PS5’s comparable launch window. Eager buyers generated such intense demand that Nintendo spent a large portion of the year apologizing for inventory shortages.
Fiscal 2026 revenue witnessed a near-doubling. Net sales reached ¥2,313.1 billion, representing a 98.6% increase, while net income climbed 52.1% to ¥424.1 billion. In a genuine shift in capital allocation, the company uncharacteristically accelerated buybacks to roughly ¥100 billion from virtually zero and raised its dividend twice to finish the year at 219 yen.
Nintendo has a robust content pipeline. Fueled by a 40th-anniversary campaign, the Super Mario Galaxy film dominated the box office earlier this year. Meanwhile, the Star Fox remake nearly doubled its predecessor’s UK opening. Pokopia sold 2.2 million copies in four days, and Pokémon Winds and Waves is slated for 2027.
Management has a history of sandbagging, and then beating their earnings guidance. Nintendo’s initial FY2026 guidance was exceeded by 22% on revenue, 12.5% on operating profit, and 32% on Switch 2 hardware units. Bulls believe the FY2027 guidance is just the latest lowball, with Bloomberg reporting in May that internal hardware targets are roughly 20% higher than the public outlook.
In a vacuum, the above news is great but it ignores the core bear case. Post-launch excitement masks the fundamental issue: worsening unit economics for each console sold. Despite financial reports framing it strictly as a hardware company, the market continues to value it at a lofty software multiple. Let’s break down the data.
2. The attach rate has collapsed, and the bundle is hiding it
The single most important metric in the console business is one most bullish Nintendo coverage never mentions: the attach rate, which is the number of software units sold per video game console sold. Think of consoles (hardware) as the razor and the games (software) as the blades. Consoles are sold at thin margins, or sometimes, at losses, on the expectation that each console generates years of high-margin game sales. If the attach rate is falling, the entire economic model of the platform weakens, no matter how good the initial hardware sales.
The headline attach rate is already showing erosion. In its first ten months since launch, Switch 2 sold 19.86 million consoles and 48.71 million games, an attach rate of 2.45. Over the original Switch’s comparable launch window, the figure was 3.57. That’s a 31% decline, launch window versus launch window, before we adjust for anything…
And the headline number is doing some heavy lifting it shouldn’t be.
Here’s the part I haven’t seen anywhere else, and Nintendo tells you the number itself if you read the footnotes. Bundled software is booked inside hardware revenue, but the bundled copies still get counted in the software unit totals. And in the fine print of the FY2026 sales-units table, Nintendo discloses the figure: approximately 12.60 million of those 48.71 million Switch 2 “software units sold” were bundled, not bought. That’s 25.9% of the entire software number, and it implies roughly 63% of Switch 2 consoles went out the door with a game already in the box.
Strip the bundled copies out and the organic attach rate, games people actually chose to buy with their own money as a separate decision, was 1.82. So instead of being 31% below the original Switch, it was 49% below. The headline number isn’t just flattered by the bundle. It’s nearly doubled by it.
Nintendo’s software base is dangerously concentrated. Mario Kart World alone accounts for 14.70 million units, 30.2% of every Switch 2 game sold in the fiscal year. When one title is nearly a third of the software business, that is a risk. The rest of the launch slate hasn’t developed the depth that made the original Switch’s catalog so popular. Later on in this article, I’ll show that the broader console industry’s revenue concentration is itself extreme, with nearly two-thirds of console revenue flowing to just twenty titles. In other words, Nintendo’s game portfolio is more concentrated than the industry average.
Counterintuitively, Switch 2’s backward compatibility is part of the problem. When it was announced that Switch 2 would be able to play the entire Switch 1 library, that was a genuine consumer win and a real launch accelerant. But it also meant every upgrader arrived with a decade’s worth of games they already owned, and less urgency to buy new ones. Nintendo guided Switch 1 software down 23% this year while hoping Switch 2 software grows into the gap. The early organic attach data suggests the gap isn’t being filled so much as carried forward, unmonetized.
3. Margins: what’s expected, and what isn’t
Yes, gross margin fell hard this year, from 61.0% to 39.3%, and a good chunk of that is exactly what you’d expect. Hardware jumped from 43.7% to 66.7% of platform sales in a launch year, a 23-point swing in one year; hardware carries structurally thinner margins than software; any console maker’s blended margin dips when a new box is flying off shelves faster than the attach rate can catch up. I don’t think the raw margin print, by itself, is the interesting evidence here. What’s interesting is what’s underneath it, and whether it’s actually going to normalize the way launch-year margin dips normally do.
The part that isn’t a normal launch-year story is memory. TrendForce, a memory and semiconductor research outlet, puts memory at 21-23% of a console’s total bill of materials in 2026. DDR5 module prices are up more than 370% since September 2025, as AI datacenter demand devours global memory supply, a cost shock that has nothing to do with Nintendo’s launch cycle and everything to do with a chip market Nintendo does not control. UBS Securities estimates Nintendo’s per-unit hardware gross profit is on a path from roughly plus $23 per console toward a $35-50 loss per console by the end of 2026 absent intervention. That intervention arrived in May, when Nintendo raised the Switch 2’s price from $449.99 to $499.99, mid-cycle, in year one, something it has essentially never done from a position of strength. This is the part of the margin story that doesn’t resolve just because the launch quarter passes. A normal hardware mix dip fades on its own schedule. A memory-cost dip fades on the AI industry’s schedule, and nobody, Nintendo included, knows when that is.
If you’re reading this and you can reliably call the bottom of the memory cycle, close this tab and go start your own Substack, because half the semiconductor analysts on Earth are trying to do exactly that and failing!
And on forecasting: management’s own guidance record on margin specifically, not units, is worth flagging. Nintendo beat its initial FY2026 revenue and operating profit guidance comfortably, which is the well-known sandbagging pattern I’ll come back to. But the final revision tells a narrower story. In February 2026, two months from year-end, management guided ¥370 billion of operating profit. The actual number was ¥360.1 billion. A miss, on the margin line specifically, from sixty days out, even as sales beat. Whatever you think about Nintendo’s twenty-year history of sandbagging unit volumes, this particular line, the one the memory cost hit, is the one management couldn’t call two months out.
A short pause before I get to the competition section, because I want to show how the market has reacted in real time to Nintendo’s periodic updates to its guidance and Switch 2 sales.
In March 2026, news broke that Nintendo had cut its quarterly Switch 2 production target by roughly a third, from 6 million units toward 4 million. Asymmetric Advisors’ Amir Anvarzadeh called it “awful news” for the growth narrative.
In May, the FY2027 guidance and the price hike landed together, and the stock fell 8% in a day, taking it down 34% for the year.
In June, Nintendo held its summer Direct, and the flagship reveal was a remake of a 28-year-old Zelda game rather than a new Mario title; the stock gave up another 8%.
Three separate times this year, investors were shown new information about this cycle, and they marked the company down.
What I don’t think is fully priced in is that Nintendo’s target gaming audience now has options it didn’t have last cycle. That’s where we go next...
4. The competitive encirclement: PC gaming and the portable moat that wasn’t
This is the part of the thesis that other Nintendo writers skip entirely, and it’s where I want to spend the most time. My primary source here is Newzoo’s 2026 PC & Console Gaming Report, the industry-standard market research published this spring. Here are a few notable findings:
PC gaming is overtaking consoles. Newzoo forecasts PC gaming revenue growing at a 6.6% annual rate from 2025 through 2028, against 4.4% for consoles. At that pace, PC would overtake console revenue by 2028 for the first time in over a decade, within a combined market growing from $88.3 billion to $103.7 billion. The player base tells the same story: PC gamers are set to grow from 936 million to over a billion by 2028, while console’s audience crawls from 645 to 688 million. In 2025 engagement terms, PC playtime rose 3% while PlayStation fell 4% and Xbox fell 3%. The industry’s center of gravity is moving, and Nintendo is on the losing end.
Nintendo is one of only four trends holding up console growth, which is a risk, not a moat. The report lists four main growth drivers: 1) Nintendo’s Switch 2 and first-party lineup, 2) GTA 6 (Grand Theft Auto) and a handful of other blockbusters, 3) higher pricing, and 4) a next hardware generation that doesn’t arrive until 2027-28 and brings “limited player growth” even then. So Nintendo isn’t merely exposed to a decelerating category; it is like a load-bearing wall helping to support the category’s growth…for now.
Nintendo’s handheld moat is already broken, even if the unit math looks tiny. The lazy version of this argument says Steam Deck is eating Switch demand, but unit numbers don’t fully support that thesis. For readers who don’t live in this world: the Steam Deck is a handheld gaming device made by Valve, the company behind Steam, the dominant PC game store. It has sold perhaps 4-5 million units lifetime, and the entire tracked handheld-PC category, the Deck plus rivals like ASUS’s ROG Ally and Lenovo’s Legion Go, is under 6 million cumulative. Measured against 19.86 million Switch 2s in ten months, that’s a rounding error.
The real argument is about the category, not the units. For twenty years, if you wanted portable, premium gaming, you bought Nintendo hardware. That monopoly is over. A price-sensitive buyer standing in the $400-500 aisle now chooses between a closed ecosystem with $70-80 first-party software and an open one attached to Steam’s library and its perpetual discounting. Valve’s ambitions are visibly escalating too: it launched a living-room console, the Steam Machine, at roughly PS5-class performance, on June 29 of this year, and has confirmed a Steam Deck 2 is in development.
The finding I think matters most in this entire report: the industry’s growth is concentrating in a price tier where Nintendo doesn’t compete. Newzoo’s own summary calls the $30-$50 band “the new sweet spot,” the fastest-growing price segment across every platform. Below it, the sub-$30 tier is thriving structurally on PC. Sub-$30 new releases alone grew revenue 156% from 2022 to 2025 and now generate 9% of all PC revenue by themselves. Above it, the $50-plus tier still captures 76-89% of PlayStation and Xbox premium revenue, but it’s the slowest-growing part of the market, flat outright on Xbox.
And what is Nintendo doing? Moving in the exact opposite direction. Mario Kart World launched at an unprecedented $79.99, above even the console industry’s $50+ ceiling, while the hardware went from $449.99 to $499.99. Nintendo is pushing deeper into the most expensive, most saturated, flattest-growing corner of the market. I think it’s the single most underappreciated fact in the whole story.
Even the high-end tier that console still dominates is quietly splitting apart by platform. Revenue in the $50+ tier grew 58% on PC from 2022-2025, 34% on PlayStation, and 0% on Xbox. Isolate genuine standalone premium games, excluding live-service titles and annual sports franchises, and it gets starker: PC +32%, PlayStation +14%, Xbox minus 22%. The traditional single-purchase premium console game, the thing Nintendo’s entire software model is built on, is a shrinking business on one of the two competing consoles and a barely-growing one on the other.
So what’s propping up PlayStation’s and Xbox’s premium numbers? Annual sports franchises, a floor Nintendo doesn’t have. EA Sports FC 26 by itself is 9.8% of all PlayStation revenue. Add its predecessor and two NBA 2K editions and four annual sports titles account for roughly a quarter of all PlayStation revenue; Xbox leans on the same crutch for about a fifth of all Xbox revenue. These franchises are the console premium tier’s recurring, predictable, low-risk cash flow. Nintendo has never had an equivalent. And notice the pattern: just as live sports have become some of the last must-see, appointment content holding the TV and streaming bundle together, sports franchises are quietly becoming one of the few dependable annuities left in premium gaming. In both industries, as everything else fragments, sports is the content that keeps people paying every single year.
Console lives and dies by a handful of hits; PC increasingly lives off the long tail. Remember Mario Kart World at 30.2% of Switch 2 software? Newzoo’s data shows the console industry at large runs on the same fragile fuel. Nearly two-thirds of console revenue flows to the top twenty games, while more than half of PC revenue comes from titles ranked 21st or lower, a long tail that grew 44% by playtime from 2022 to 2025, the largest structural shift on any platform. The platform that’s growing rewards depth, breadth, and back catalogs. The platform model Nintendo depends on rewards hits, and punishes their absence. Nintendo is currently running the most extreme hit-concentration in the business inside the industry structure least forgiving of it, and it’s a real, underestimated business risk that Nintendo’s fans wave away every time the next first-party title lands.
Sony and Microsoft have already capitulated to this reality, which raises Nintendo’s stakes rather than lowering them. Sony now ports its former exclusives, Spider-Man, God of War, to Steam as a matter of course. Microsoft ships day-and-date on PC. A well-equipped PC already plays both competitors’ catalogs, which means Nintendo’s IP quarantine is the only remaining reason anyone must buy a dedicated console. That’s not a wider moat. It’s Nintendo betting the whole console on each new game clearing the bar, with little margin for error.
Bulls will say Mario, Zelda, and Pokémon never leave Nintendo hardware, so none of this PC data touches the core franchise engine. While true, it misses the point. Exclusivity determines who must buy the hardware; price determines how many will. A $500 entry fee to access quarantined IP shrinks the addressable audience at exactly the moment third-party games, the Cyberpunks and Elden Rings that fill out a console’s library, lose their reason to exist on Switch 2 whenever a better, cheaper PC version sits one input away.
Fun fact: Steam, a business most Nintendo investors never think about, runs 132-147 million monthly active users and roughly $16-18 billion in annual revenue. Its storefront is already bigger than all of Nintendo. This is the exact dynamic I’ve been writing about with YouTube versus the entire TV and film landscape for over a year now on Accrued Interest: a massive, disruptive competitor operating in plain sight, and because it’s tucked inside a private company (Valve) or a division of a larger public one (Google), the market underestimates it. Steam, and PC gaming more broadly, is reshaping the entire ecosystem, and Nintendo is not immune.
5. The IP monetization mirage
There’s a second bull thesis running alongside the platform story: that Nintendo is quietly becoming “the next Disney,” that a portfolio of movies, theme parks, and merchandise will build a real IP monetization flywheel and diversify the company away from console cyclicality. The narrative is popular online, but it’s also wildly overstated, and the filings show exactly why.
Mobile and IP-related income is only 3.2% of revenue. ¥73.5 billion out of ¥2,313 billion in FY2026. Through nine months it ran 2.86%. The line has oscillated between roughly 3% and 7% of sales over the last five years and has never broken out — and the high print, FY2025’s 7%, came not because IP got bigger but because Switch 1 sales collapsed into the Switch 2 transition. The ratio spiked because the denominator caved in. If this segment were materially large, you can bet management would carve it out and invite you to apply a Disney multiple to it. The Super Mario Movie, most successful video game film adaptation ever made, only moved this needle from “rounding error” to “slightly larger rounding error.”
And the movie’s halo effect, which was real, stayed in its silo. Mario Kart 8 Deluxe sales visibly accelerated in the quarters after the film was released. However, what about the non-Mario games? Metroid didn’t move more units…What Nintendo has isn’t a flywheel; it’s a franchise-specific marketing amplification tool. Releasing roughly one theatrical event every two to three years is simply not enough. A real IP monetization flywheel looks like Disney’s machine, which publishes many interlocking releases annually across film, streaming, parks, and consumer products, built on decades of infrastructure so that each release feeds every other line of business. Nintendo’s IP operation is solid, but at 3.2% of revenue, it can’t mathematically rescue a multiple that’s mispricing the other 96.8%.
6. The Sony comparison: why the multiple gap isn’t earned
Time for the accounting section, so the paid subscribers get their money’s worth. If you read my Netflix Q2 2026 earnings deep dive, you know I believe return on equity, decomposed properly, tells you more about the underlying health of a business than any narrative can. So let’s run Nintendo’s, against the most instructive comp available: Sony, a company that just executed the exact same maneuver, a generational console transition, without falling down the stairs.
First, Nintendo against itself. I pulled the audited “key financial data” tables from Nintendo’s own annual reports going back eight years. Here’s the pattern:
Two things jump off this table. First, ROE peaked at 28.1% in the pandemic year, cratered to 10.5% in the pre-launch trough, and has recovered to only about 14.9% in FY2026, the year of the biggest console launch in the company’s history. That 14.9% is barely above FY2019’s 14.2%, which was the sleepy, late-cycle twilight of the original Switch, when Nintendo had nothing new to sell at all. A launch that consumed years of development, record marketing spend, and twenty million consoles had roughly the same profitability of a year when almost nothing was happening. Second, look at the P/E column. Nintendo traded between 13.8x and 15.3x for three consecutive fiscal years, 2021 through 2023.
Now Sony, through the identical test. Across the PS4-to-PS5 transition, Sony’s ROE went from 11.9% to 15.4% to 15.6%. It expanded through the changeover, while Nintendo’s collapsed by two-thirds peak-to-trough. Three structural reasons explain the difference. 1) Sony is a conglomerate, with music, pictures, and imaging sensors whose other cash flows shock-absorb console economics. 2) Sony’s capital allocation also keeps the equity base working, through consistent buybacks and M&A, where Nintendo lets cash pile into a ¥2.2 trillion mountain that drags reported returns (credit again for this year’s ¥100 billion buyback step-up; it’s a start, and also only 4-5% of the cash pile). And 3) most important for this story: the subscription floor.
The subscription comparison is where the “software platform” thesis goes to die. Nintendo Switch Online has roughly 34 million subscribers at $19.99-49.99 a year. PlayStation Plus has 47 million at $79.99-159.99. Sony converts about 36% of its ecosystem into subscribers; Nintendo converts about 26%, at a fraction of the price. PS Plus alone generates north of $3.8 billion annually, a genuine recurring floor under Sony’s console cyclicality. And the gap is about more than price.
Remember the Newzoo finding that titles six-plus years old absorb a third to two-thirds of all playtime, depending on platform, while new releases capture just 10-13%? Gamers everywhere mostly play what they already own; that’s universal, not a Nintendo-specific phenomenon. The difference is what each platform’s subscription does about it. Xbox Game Pass puts brand-new releases in front of subscribers on day one at zero marginal cost, and Newzoo credits it with measurably redistributing engagement toward newer titles. PS Plus’s upper tiers rotate a 300-400 game catalog. Nintendo Online does neither. It’s a retro library and an online-multiplayer tollbooth. There’s no mechanism anywhere in Nintendo’s ecosystem nudging a Switch 2 owner with a back catalogue of games toward trying something new. It’s a structural reason Nintendo’s organic attach rate is a low 1.82.
So what premium should the market award the company with no conglomerate cushion, no subscription floor, and a mediocre ROE? I think it makes no sense Nintendo trades at roughly a 25% premium to Sony on forward earnings, and has almost the same P/E as Microsoft. We can argue about Sony all day, but there is no version of the world in which Nintendo is a better business than Microsoft. Let’s be real…
7. Why Switch 2 will sell fewer lifetime units than the bulls think
Nintendo’s bull-bear dispute is really about the future: how many Switch 2s does this cycle ultimately sell? The Street’s implicit answer, buried in those ¥10,000+ price targets, is something like the original Switch’s 155 million. However, I think the honest answer is dramatically lower.
Start with the precedent nobody wants to discuss. Nintendo has run this exact play before: follow a beloved, mass-market hit device with a pricier successor. The DS sold 154.02 million units. Its successor, the 3DS, launched at a higher price into a world where casual gamers had found other options (at the time, smartphones), and sold 75.9 million. A roughly 50% contraction, from the strongest installed base in company history. Sound familiar? The Switch sold 155.37 million. Its successor launched at a higher price into a world where price-sensitive gamers have found other options (now, PC and smartphones). As the saying goes, history doesn’t repeat, but it often rhymes.
Now the cohort math. Split the 155.37 million Switch 1 owners into two groups. Core enthusiasts, call them 30% of the base, or 46.6 million people, will pay $450-500 for Nintendo hardware almost regardless of price. Assume essentially all of them convert. The remaining 70%, some 108.7 million price-sensitive casual players, the families and lapsed gamers the original Switch uniquely captured at $299, are the contested cohort, and they’re precisely the buyers the $30-50 PC market and the handheld alternatives compete for. Assume a 25% conversion in the downside case: 27.1 million. Add roughly 10 million genuinely new-to-Nintendo entrants, a deliberately conservative figure given the competitive section above. Total: roughly 83.7 million lifetime units. Call it a 75-85 million range rather than false precision. That’s a 45-52% contraction from Switch 1, almost exactly the DS-to-3DS rhyme.
The launch-year strength doesn’t refute this; it’s consistent with it. 19.86 million units in ten months sounds like a number that laughs at an 80 million ceiling. But run it against the cohorts: the launch already consumed roughly 40% of the entire enthusiast cohort. A blistering start driven by front-loaded superfans is exactly what the downside case predicts. The question was never year one; it was whether the casual 70% shows up in years two through five at $500 with a $30-50 PC ecosystem bidding for them. Nintendo’s own year-two guide of 16.5 million units, lower than year one, says management is asking the same question. And notably, this is the one place where the famous sandbagging may not save the bulls: even Nintendo’s internal stretch target reported by Bloomberg, around 20 million, implies a cycle tracking toward the middle of my range, not toward 155 million.
8. Valuation: why the re-rate isn’t coming
Let me repeat the framing so there’s no ambiguity: this is not a prediction that Nintendo’s stock crashes from here. It already fell 56% from its high; the market has done real work. The claim is narrower. The multiple remains somewhat rich against Nintendo’s own history and its peers, and I see no visible catalyst for it to expand.